Reg CF Fundraising to Date in 5 Charts
Here’s 5 charts visualizing some of that data that help provide some insight into the state of Regulation Crowdfunding as we near the 18-month mark

Reg CF fundraising (also known as Regulation Crowdfunding) has been live since May of 2016, which means almost 18 months of data is available from the filings companies must make as part of their offerings. Here’s 5 charts visualizing some of that Reg CF fundraising data that help provide some insight into the state of [Reg CF equity crowdfunding](/crowdfunded-investing-democratizes-capitalism/ as we near the 18-month mark.
The charts below are all based on “Form C (PDF)” filings with the SEC from May 2016 through Sept. 2017 (Form C is the document companies file to begin an offering — there are a bunch of other variations and forms related to updates, amendments, annual reports, and more, but the data below comes just from those initial Reg CF fundraising Form C offering filings – and in the case of the first graph, also Form C filings to withdraw offerings).
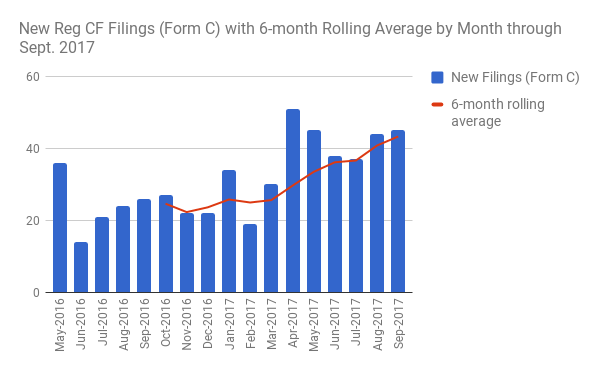
New Reg CF Fundraising Offerings Filed by Month Are Steadily Climbing
When I [interviewed Republic.co founder Ken Nguyen](/republic-ceo-ken-nguyen-interview/, he commented on how the filings trajectory was line with Republic’s expectations based on what they’d seen already happening in the UK:
What we’re doing here has been legal there for about 5-6 years. At the outset of Reg CF last May a lot of people had these lofty expectations, but the first year for us actually met our expectations. It was 10X what the UK did in year 1, and the UK has about 1/10 population, so if you follow that traction, it will be 3-5 years to become a $1B industry.
And indeed when you look at the pace of filings by month, it’s a steady march upwards (with the exception of the very first month Reg CF went live, with its spike attributable to a pent up pipeline of offerings:

That chart also charts the 49 offering withdrawals (interesting almost a quarter of those were associated with DreamFunded, likely tied to their decision to pivot away from startups and to Real Estate).
The (gentle) upward trend is clearer when you add a 6-month rolling average:
Almost 60% of Reg CF Fundraising Campaigns go through just 3 Intermediaries
Title III Funding Portal Wefunder got some press on the first anniversary of Reg CF as the most active portal by volume, but since then fellow portal StartEngine has ramped up considerably — since May of this year, 58 companies have filed to list on StartEngine vs. 51 on Wefunder:
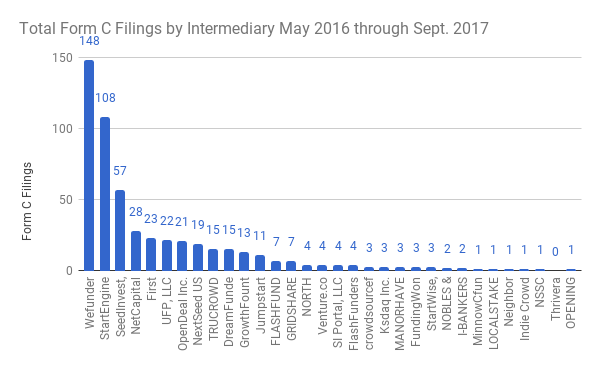
Adding in SeedInvest, as of September 2017 the top 3 portals by volume have been responsible for nearly 60% of all the Reg CF Filings.
Startups are Aiming Low (but Shooting High) with their Reg CF Fundraising Targets
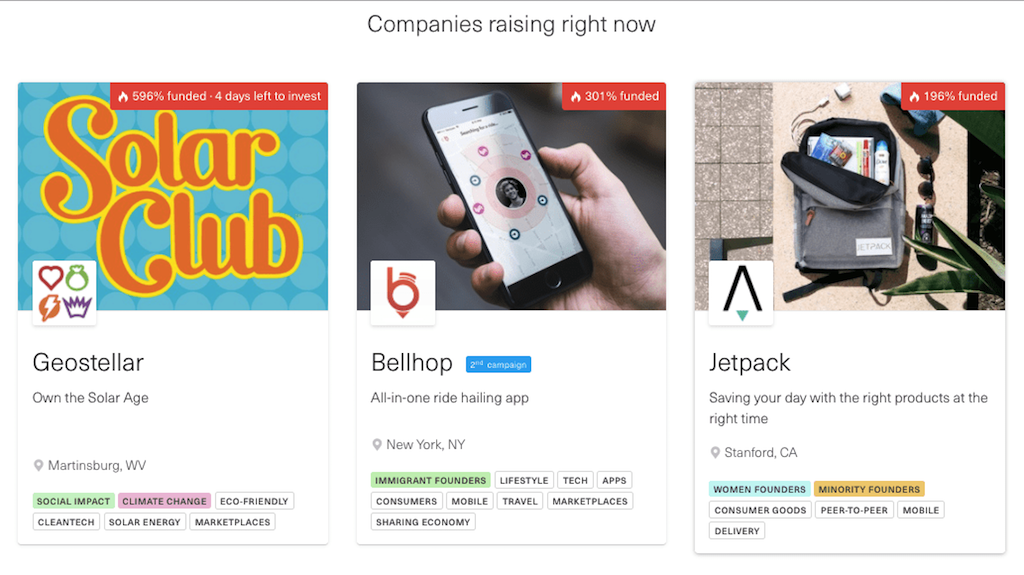
When filing a Form C with the SEC, companies indicate their target fundraising amount, along with an optional maximum amount. A side effect of setting a low Reg CF fundraising target (but leaving the option open to take in more with a high maximum) is that a company can quite quickly start marketing themselves as “more than 100% funded,” as in these examples from Republic:
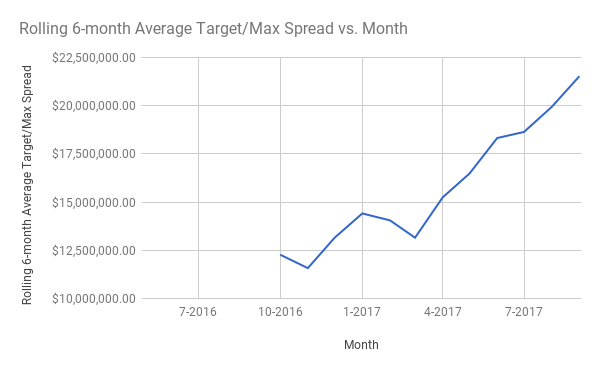
A hypothesis here is that startups (and intermediaries) have concluded that aiming low but shooting high makes for good marketing, and so have begun dialing down their target amounts. And indeed, when you look at the data, the total target amount being sought has held steady at about $3M each month even as the number of offerings has grown (reflected in the steady climb in the total maximum amount of each month’s filings):
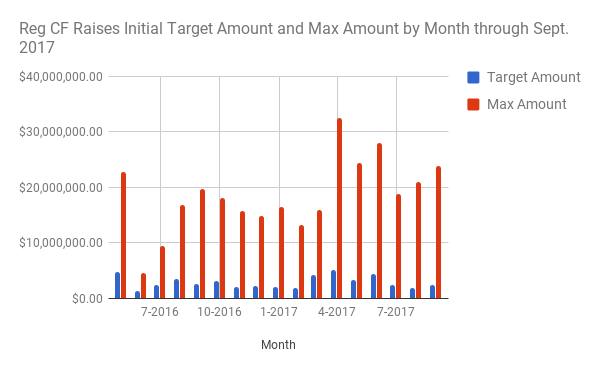
The growing spread between the target and maximum amounts shows up more clearly when you look at the 6-month rolling average difference between the total target amount each month vs. the total maximum amount each month through September 2017:
The Data Exhaust of Reg CF Fundraising
While there’s legitimate concern among entrepreneurs that the filing and reporting requirements of Reg CF (and Reg A+) are onerous, the good news for investors is that it generates a steady stream of information about the companies and the intermediaries helping them with their offerings.
Want to learn more but aren’t sure where to start? You can explore 168 crowdfunding investment platforms in our database and learn more about the nuts and bolts of crowdfunding and alternative investing on our blog. Did you know you can use a self-directed retirement account to invest in many alternative investments? Rocket Dollar makes it easy, and when you sign up using that link you'll be helping to support YieldTalk.
Share this post:
Other Investment Opportunities
Featured Reviews

EquityMultiple
EquityMultiple stands out among real estate crowdfunding investment platforms because their main investors and senior leadership come from institutional real estate finance, rather than being VC-funded. Seed funding for the company was provided by Mission Capital (later acquired by Marcus & Millichap) and their co-founders and board of advisors come from the New York real estate finance and law community. They offer fewer investments than some other platforms, but that’s a deliberate choice to take a more curatorial approach to dealflow. Overall, EquityMultiple is a solid choice for accredited investors looking for a hands-off way to invest in commercial real estate.
"Gain exclusive access to high-yield commercial real estate deals"
Read more
First National Realty Partners
First National Realty Partners (FNRP) is a commercial real estate private equity firm that focuses on grocery-anchored commercial shopping centers, offering both investments in individual properties and an Opportunity Fund across all of their offerings.
"First National Realty Partners (FNRP) is a rapidly growing commercial real estate private equity firm that owns and operates real estate throughout the United States. FNRP focuses on expanding its portfolio by acquiring market-dominant, well-located commercial assets well below replacement cost. "
Read more
Percent
Percent aggregates private-credit investments from a range of originators offering small-business, crypto, venture loans, litigation finance and more, including international debt investments. Low minimums.
"Percent unlocks exclusive private credit investments for your portfolio. Access select alternative investments on the platform powering the future of private markets."
Read more